As new renewable energy generation sources integrate into the grid and demand for electricity from data centers continues to grow, managing energy demand has become challenging for most market operators. The Load Duration Curve (LDC) is a new way of visualizing energy demand in real-time to help grid operators plan for fluctuations in demand. In this article, we will explain the Load Duration Curve (LDC), how it differs from traditional chronological load curves, and its role in helping system operators make decisions on a daily basis.
What Is The Load Duration Curve (LDC)?
The Load Duration Curve (LDC) is a tool used to visually display electricity demand over a period of time, by load type. Unlike traditional load curves that simulate energy load in chronological order, the LDC displays load demand by load type and forecasts the duration of each load. The curve may include several time intervals, such as hourly, daily, weekly, or monthly forecasts, and is used to paint a clearer picture of demand variability throughout the electrical system
The Makeup Of The Load Duration Curve
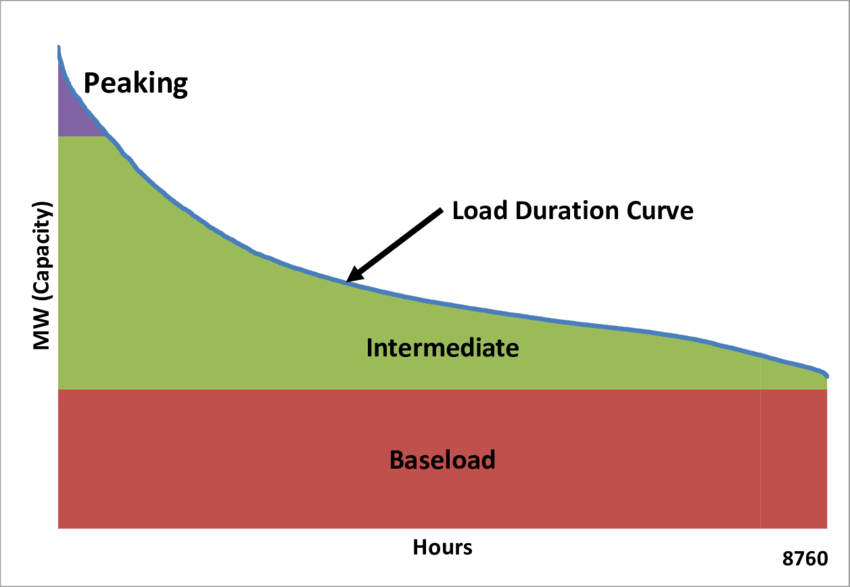
A Load Duration Curve chart will display three different load types to system operators: Base Load, Intermediate Load, and Peak Load.
Here is an example of a Load Duration Curve (LDC) chart [source: Research Gate]:

Base Load
The Base Load in an electrical system is the consistent minimum level of electric demand from all consumers on a grid. Base Load is often served by low-cost generators with consistent output.
Intermediate Load
Intermediate Load represents variable demand that occurs regularly, but is not consistent. Variable load can arise from sudden increases in economic conditions or from weather events in certain regions.
Peak Load
Peak Load is the highest demand levels in an electrical system. Peak load is often represented by high demand in summer months for cooling and directly impacts the capacity markets in most RTO/ISO regions. Peak load can also spike as a result of extreme weather events such as Winter Storm Uri in Texas in February 2021 that sent hourly prices to $9,000 per MWh.
By representing each of these load forecasts in different data sets, the Load Duration Curve gives market regulators the insights needed for system planning, generation dispatch, and curtailment orders.
How Load Duration Curves Aid Grid Management
LDCs offer great detail to grid operators for system planning. Here are some of the benefits of managing the transmission system using Load Duration Curves.
Capacity Planning
Long-term duration curves allow system operators to plan for capacity in order to meet future load demand. These curves can help predict future demand for an electrical system and even play a role in the capacity auctions hosted on an annual basis in most markets.
Operating Reserves
Operating reserve capacity is an ancillary services available to generators registered in most markets. The LDC allows system operators and generators alike to estimate how much reserve capacity is needed to ensure a reliable electric system. The LDC can directly influence the value of these markets.
Frequency Regulation
The LDC can help to identify grid stress points and the areas where additional capacity is required to balance frequency. In today’s market, this presents an opportunity for battery storage asset owners to participate directly in the wholesale markets and receive value for their added capacity.
Generation Dispatch
Load Duration Curves help grid operators make decisions on when to dispatch fast-ramping generation assets, such as natural gas peaking plants. Without insight into these details, system operators lack the ability to properly plan for peak events.
Benefits For Energy Customers
Visualizing energy usage patterns using building energy management systems in another benefit of the Load Duration Curve for end users. While not a typical application, sophisticated users can manage their energy loads in real time using this protocol in order to implement various energy-savings measures.
Load Shifting & Peak Shaving
Consumers can use energy demand data to understand their peak load on an hourly and monthly basis. This allows facility managers to shift operations to reduce peak load, or even turn on backup generators as a way to peak shave, ultimately reducing costs related to energy demand.
Demand Response Participation
Load data is also utilized in demand response programs. Demand response allows consumers to get paid capacity rates for their reduced load during peak summer months in exchange for relieving stress on the electrical system. This data can help building managers respond in real time to demand response events so that they can capitalize on this energy incentive.
Time-Of-Use Rate Response
In certain utilities, time-of-use rate tariffs are available to large commercial and industrial users. Understanding when energy is being consumed can help customers make informed decisions on the cost benefits of switching to these rate programs. Furthermore, this data can help consumers to understand their load factor rating, which directly impact retail energy pricing in deregulated energy markets.
Capital Investment Planning
Another key aspect of understanding load data is forecasting returns on capital investment projects, such as behind-the-meter energy resources. While these investments often require high upfront capital investment, good energy consumption data can paint a picture of energy savings and ROI.
Renewable Energy Integration
The intermittent nature of solar and wind generating assets affect load generation profiles for grid operators. These supply sources must be accounted for when planning for power dispatch into the electricity grid, and the load duration curve can help system operators understand how to deploy renewable energy. For example, if the LDC indicates high peak demand in a given region, a system operator might call on battery backup resources to dispatch energy in order to meet the peak. If Battery Energy Storage Systems (BESS) assets are not enough, a high-turbine gas generator might need to be ramped up in order to manage the supply-demand balance in the system. This new way of looking at load data allows for a more flexible energy system and contributes to the goals of developing smart grid technologies.
How Load Forecasting Influences Pricing
Energy demand directly impacts electricity price in the wholesale day-ahead and real-time energy markets. Using historical LDC data to model future energy consumption forecasts, grid operators implement sophisticated calculations such as spatial load forecasting to determine the amount of energy required to meet future demand. As planning continues, load will directly affect:
Locational Marginal Pricing (LMP)
Locational marginal pricing is a mechanism used to determine the cost of delivering power to different locations, or nodes, on the electricity grid. It reflects the real-time marginal costs of supplying the next Megawatt of electricity to meet demand at a given location. The LMP rate is calculated by summing energy costs, congestion costs, and line losses at a particular location. Understanding the demand needs of each node is critical to grid operators so that they can schedule the necessary resources to meet that area’s load. This directly impacts the cost of energy based on the generation source.
Congestion Pricing
Part of the total LMP price, congestion costs are a measure of transmission constraints that prevent lower cost energy from reaching a region. When there is a lot of demand at a given node, congestion pricing rises. Some energy traders take advantage of price differentials in congestion by practicing energy arbitrage trading, buying low cost energy in one location and selling to a higher-priced location.
Capacity Auctions
Capacity auctions occur in deregulated energy markets to ensure there is enough energy available to meet future demand. These auctions focus on securing efficient energy supply in order to balance the stability of the grid. Understanding expected load using the Load Duration Curve is critical for these auctions and their participants so they can plan accordingly.
Need Help Planning Your Energy Demand?
Insight into detailed demand and load data helps system operators plan resources, aids building managers identify peak load times, and empowers business owners to implement demand-side strategies for energy efficiency. At Diversegy, we specialize in helping commercial and industrial clients leverage data from the Load Duration Curve for smarter energy planning. Contact our team of energy experts today to discuss your energy load, usage patterns, and strategies for reducing costs.


