The Energy Generation Fuel Stack is a critical component to understanding the dynamics of the power markets and electricity production across the globe. As the world moves through energy transition towards sustainable energy solutions, the mix of fuels used for electricity generation has never been more diverse. From the steadfast coal and natural gas to the onset of wind and solar, each power source plays a pivotal role in shaping our energy landscape. In this article, we delve into the various types of electricity generation that power our world today, breaking down their contributions by percentage. Our exploration will not only highlight the current state of energy production but also shed light on the shifting trends that are defining the future of energy.
Electricity Generation By Source
By the end of 2023, utility-scale electricity generation facilities in the United States produced approximately 4.18 trillion kilowatt hours (kWh) of electricity. Fossil fuels, including coal, natural gas, petroleum, and other gases, accounted for around 60% of this total production. Nuclear energy contributed about 19%, while renewable energy sources made up roughly 21% of the electricity generation. Additionally, the U.S. Energy Information Administration (EIA) has estimated that small-scale solar photovoltaic systems contributed an extra 73.62 billion kWh to the overall electricity generation for the year. See the table below outlining electricity generation by source:
U.S. utility-scale electricity generation by source, amount, and share of total in 2023
| Energy source | Billion kWh | Share of total |
| Total – all sources | 4,178 | |
| Fossil fuels (total) | 2,505 | 60.0% |
| Natural gas | 1,802 | 43.1% |
| Coal | 675 | 16.2% |
| Petroleum (total) | 16 | 0.4% |
| Petroleum liquids | 12 | 0.3% |
| Petroleum coke | 5 | 0.1% |
| Other gases3 | 11 | 0.3% |
| Nuclear | 775 | 18.6% |
| Renewables (total) | 894 | 21.4% |
| Wind | 425 | 10.2% |
| Hydropower | 240 | 5.7% |
| Solar (total) | 165 | 3.9% |
| Photovoltaic | 162 | 3.9% |
| Solar thermal | 3 | 0.1% |
| Biomass (total) | 47 | 1.1% |
| Wood | 31 | 0.8% |
| Landfill gas | 8 | 0.2% |
| Municipal solid waste (biogenic) | 6 | 0.1% |
| Other biomass waste | 2 | 0.1% |
| Geothermal | 16 | 0.4% |
| Pumped storage hydropower | -6 | -0.1% |
| Other sources | 10 | 0.2% |
The Future Of Electricity Generation Sources
According to the EIA, 2024 energy market projections indicate significant growth in solar electricity production in 2024 and 2025. This new energy trend will be mainly fueled by new utility-scale solar capacity. In 2023, the electric power sector expanded its solar capacity by 19 gigawatts (GW), marking a 27% increase. It’s anticipated that an additional 36 GW will be added in 2024, followed by another 35 GW in 2025. This expansion is expected to elevate solar’s contribution to total U.S. electricity generation from 4% in 2023 to 6% in 2024, and then to 7% in 2025.
As renewable energy sources ramp up, we foresee a decrease in electricity generation from fossil fuels. The proportion of U.S. electricity generated by natural gas is projected to dip from 42% in 2023 to 41% by 2025. Similarly, coal’s share is expected to decline from 17% to 14% over the same period. Despite low natural gas prices, a significant increase in electricity generation from natural gas is unlikely because many efficient coal plants are still operating, which are expected to continue running even at low natural gas prices.
Electricity Consumption Predictions
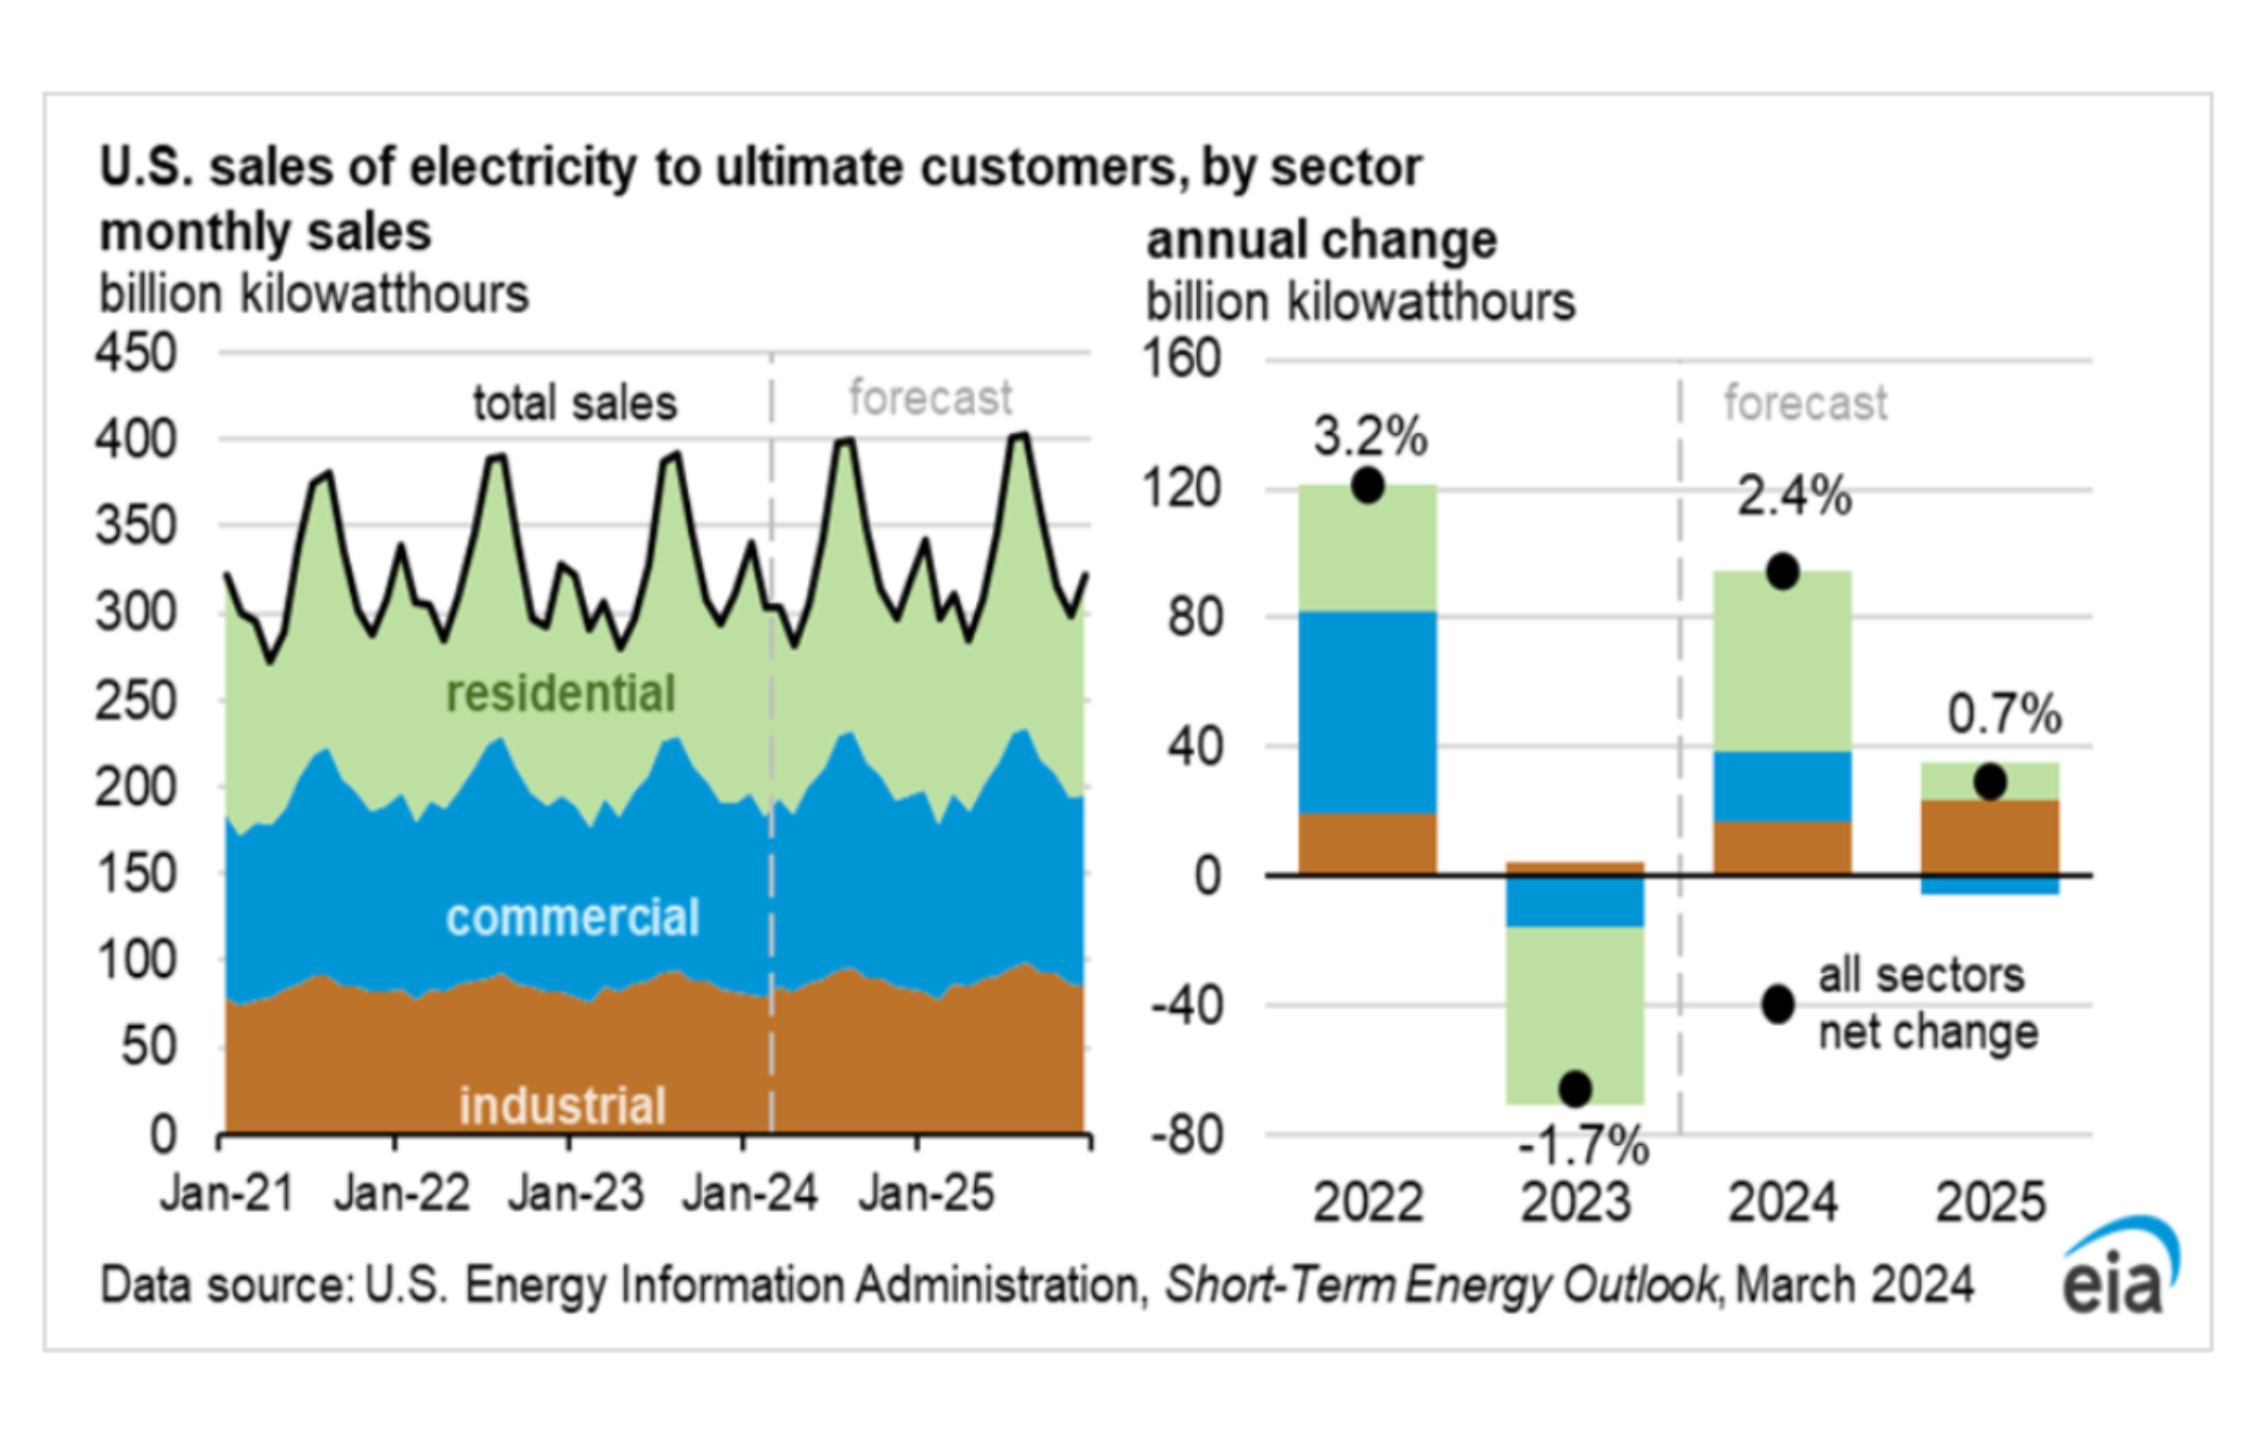
Projections for electricity consumption indicate a 2% rise in electricity sales to U.S. end-users in 2024 and a further 1% increase in 2025. Anticipated growth in electricity use across all key sectors, with the residential sector expecting to see a notable 4% increase. This growth in residential electricity consumption is particularly pronounced during the summer months of 2024, driven by air conditioning from an anticipated warmer season. A 7% increase in cooling degree days during the second and third quarters of 2024 is predicted, compared to the same periods in 2023.
The warmer summer conditions are also projected to elevate electricity use in the commercial sector. Additionally, expected improvements in economic conditions are set to enhance electricity sales to the commercial and industrial sectors by a collective 2%.
The chart below, from the EIA, outlines total electricity sales and projections in billions of kilowatt hours (kWh) across each sector of the U.S. economy:

Ready To Speak With An Electric Market Expert?
Our team of electricity experts has decades of experience negotiating with electricity suppliers, evaluating consumption trends, and matching our customers with the best-fit electricity supply products. Contact us today to learn more about the power markets, and find solutions that can help you to reduce your electricity costs.


